Mah ôe!
No post de hoje, coloquei alguns comandos interessantes que usam o pacote twitteR para analisar twitts AH JURA .

Para poder acessar as informações do twitter através de sua API, é necessário que o(a) usuário(a) crie um aplicativo(pelo nome parece algo complicado, mas é bem simples) para que se possa obter quatro dados para autenticação: Consumer Key, Consumer Secret, Access Token e Access Secret. Para obter todos esses dados, acesse esse site, crie um aplicativo novo e siga os passos da própria página.
O primeiro passo obviamente é carregar os pacotes necessários.
library("twitteR")
library("wordcloud")
## Loading required package: RColorBrewer## [1] "Using direct authentication"Após registrar seu aplicativo e obter as quatro informações citadas acima, é necessário registrar sua sessão do R para que ela possa ter acesso aos dados:
setup_twitter_oauth("CONSUMER_KEY", "CONSUMER_SECRET", "ACCESS_TOKEN", "ACCESS_SECRET")Pronto, agora é só brincar com os dados de interesse. Como exemplo, vamos dar uma olhada nas minhas mentions:
tweets <- searchTwitter("@gustavoburin", n = 200)## Warning in doRppAPICall("search/tweets", n, params = params,
## retryOnRateLimit = retryOnRateLimit, : 200 tweets were requested but the
## API can only return 33head(tweets)## [[1]]
## [1] "rpgraciotti: @lartist @alencarlrv @gustavoburin"
##
## [[2]]
## [1] "nmluchetti: @veumb @rntannus @gustavoburin Não consegui ler o texto ainda, mas só pelo mapa na África eu já veria o problema, j… https://t.co/njE9LqTzbX"
##
## [[3]]
## [1] "veumb: @rntannus @gustavoburin No Brasil, por exemplo, sabe-se pouco sobre helmintos em geral. Sabemos muito sobre parasit… https://t.co/Dh4FrgQmaB"
##
## [[4]]
## [1] "veumb: @rntannus @gustavoburin Não li o paper. Mas se eles se basearam em dados de coleções, com certeza. Os dados de cole… https://t.co/gN7TCsmYzq"
##
## [[5]]
## [1] "rntannus: @veumb @gustavoburin oh manjo nada de bicho, menos ainda de parasita, mas isto aí não tem correlação com esforço amostral ?"
##
## [[6]]
## [1] "veumb: @gustavoburin Eu vi mas não li! Valeu! Eu conheço essa galera. Já publiquei com eles."Ainda não descobri o porquê, mas a API do twitter está limitando as minhas buscas em valores bastante aleatórios. Um dos motivos pode ser que meu aplicativo é novo, mas isso só vou descobrir daqui a um tempo. Atualizo aqui assim que souber!
Além disso, também é possível fazer olhar para os dados do perfil de algum usuário:
myuser <- getUser("gustavoburin")Essa função além de obter dados básicos como último status, id, etc., também inclui no objeto diferentes methods que permitem extrair informações mais específicas (notem que por serem funções, esses dados são obtidos usando ‘()’ no fim):
myuser$getDescription()## [1] "Proto-Evolutionary ecologist, Open-source/science enthusiast, addicted to learning and tweaking everything.\nPostdoc @ LabMeMe/USP"myuser$getFollowersCount()## [1] 476Outro modo de olhar para o twitter é através da linha do tempo de algum usuário em específico (novamente não sei porque o objeto contém menos informação do que peço na função):
usertl <- userTimeline("gustavoburin", n = 200)Uma forma de facilitar a visualização dessas informações é usando nuvens de palavras. Para isso, usaremos o pacote wordcloud. Mas antes de gerar a nuvem, precisamos organizar os dados coletados acima.
# Create an empty character vector of the same length as the number of
# tweets
tweeter <- vector(mode = "character", length = length(tweets))

# Extract the screen names from each tweet status
for (i in 1:length(tweets)){
    tweeter[i] <- tweets[[i]]$getScreenName()
}

# Compile the frequencies of each screen name
tweeter.freq <- table(tweeter)

# Black backgrounds are 'this year's colour' in terms of dataviz!
par(bg = "black")

# Draw the word cloud
wordcloud(names(tweeter.freq), tweeter.freq, colors = c("tomato",
    "wheat", "lightblue"), scale = c(4, 0.2), random.color = TRUE, rot.per = 0.5,
    min.freq = 1, font = 2, family = "serif")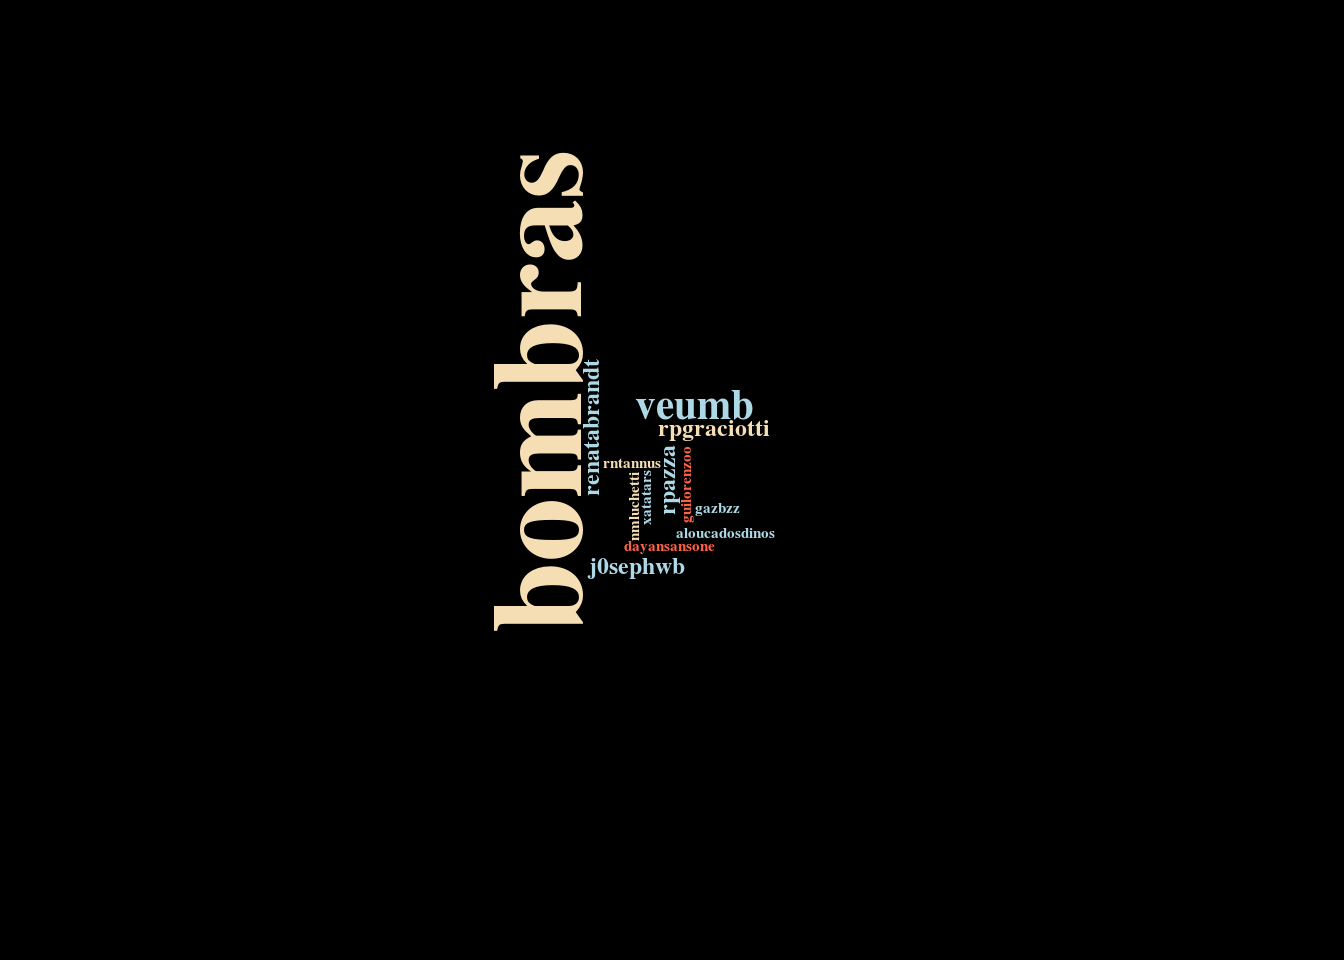
Como uma última forma (por agora) de visualizar informações de uma conta específica do twitter, podemos mapear as redes de followers e following do perfil em questão:
source("http://biostat.jhsph.edu/~jleek/code/twitterMap.R")

twitterMap("gustavoburin", fileName = "analise_twitter.pdf", plotType = "both", userLocation = "Sao Paulo")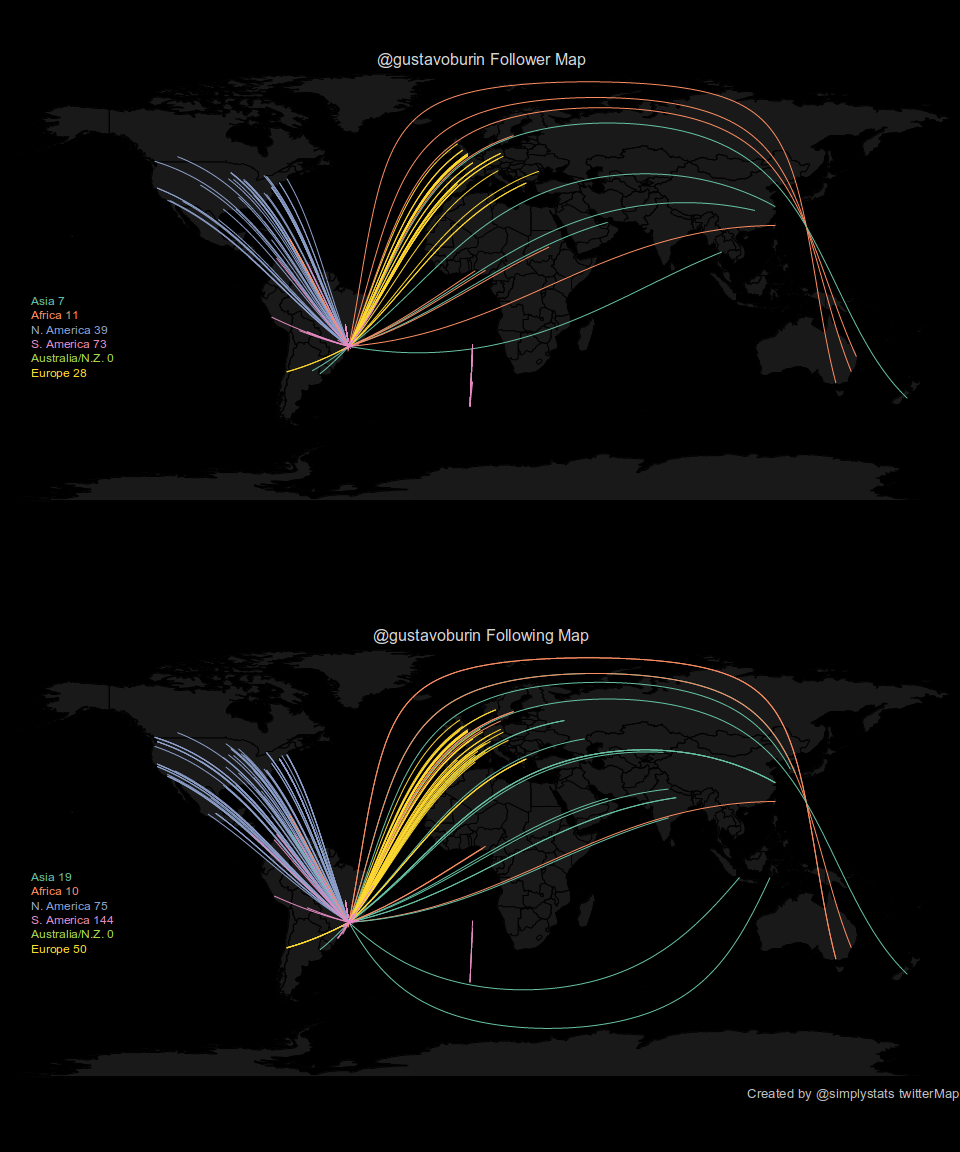
Para rodar a função acima, precisei fazer umas pequenas modificações no código, pois o reconhecimento dos dados de latitude/longitude estavam dando erro (talvez por eu não incluir a localização nos meus twitts), além de a função principal somente exportar a imagem sem plotá-la. Colocarei no fim do post as funções modificadas que usei.
Tá, mas e daí?
A motivação para eu dar uma olhada nesse pacote é que eu gostaria de em algum momento fazer uma análise quantitativa da twittosfera científica brasileira, para eventualmente traçar correlações com alguns indicadores de produtividade. Se alguém tiver interesse em olhar isso comigo, por favor entre em contato por e-mail ou twitter!
Referências (de onde tirei tudo isso?)
Tutorial simples de como extrair informações do twitter usando o R
Funções modificadas
#########################################################################################
#   An R function to make a personalized map of people you follow and who follow you on twitter.
#   R functions Copyright (C) 2011 Jeff Leek (jtleek@gmail.com), and the Simply Statistics Blog
#   (http://simplystatistics.tumblr.com, http://twitter.com/simplystats)
#
#   This program is free software: you can redistribute it and/or modify
#   it under the terms of the GNU General Public License as published by
#   the Free Software Foundation, either version 3 of the License, or
#   (at your option) any later version.
#
#   This program is distributed in the hope that it will be useful,
#   but WITHOUT ANY WARRANTY; without even the implied warranty of
#   MERCHANTABILITY or FITNESS FOR A PARTICULAR PURPOSE.  See the
#   GNU General Public License for more details, see <http://www.gnu.org/licenses/>.
#
#
#   These functions depend on the packages: twitteR, maps, geosphere, and RColorBrewer. It will
#   attempt to install them if they are not installed when you source this function. Care
#   should be used when using this function since the twitteR API has rate limiting in place.
#   If you have a large number of followers, or run the function many times, you may be
#   rate limited.
#
#
#   How to use:
#       # Source the function
#       source("http://biostat.jhsph.edu/~jleek/code/twitterMap.R")
#
#      # Make your twittermap
#      twitterMap("simplystats")
#
#      #If your location can't be found or latitude longitude can't be calculated
#      #choose a bigger city near you. The list of cities used by twitterMap
#      #can be found like so:
#      data(world.cities)
#      grep("Baltimore",world.cities[,1])
#
#      # Then make the map using that big city
#      twitterMap("simplystats",userLocation="Baltimore")
#
#      #If you want both your followers and people you follow in a plot you can do:
#      twitterMap("simplystats",plotType="both")
#
########################################################################################
getPckg <- function(pckg) install.packages(pckg, repos = "http://cran.r-project.org")

pckg = try(require(twitteR))
if(!pckg) {
cat("Installing 'twitteR' from CRAN\n")
getPckg("twitteR")
require("twitteR")
}

pckg = try(require(maps))
if(!pckg) {
cat("Installing 'maps' from CRAN\n")
getPckg("maps")
require("maps")
}

pckg = try(require(geosphere))
if(!pckg) {
cat("Installing 'geosphere' from CRAN\n")
getPckg("geosphere")
require("geosphere")
}


pckg = try(require(RColorBrewer))
if(!pckg) {
cat("Installing 'RColorBrewer' from CRAN\n")
getPckg("RColorBrewer")
require("RColorBrewer")
}


twitterMap <- function(userName,userLocation=NULL,fileName="twitterMap.pdf",nMax = 1000,plotType=c("followers","both","following")){

  # Get location data
  cat("Getting data from Twitter, this may take a moment.\n")
  tmp = getUser(userName)
  if(is.null(userLocation)){
    userLocation = location(tmp)
    userLocation = trim(userLocation)
    if(nchar(userLocation) < 2){stop("We can not find your location from Twitter")}
  }

  followers=tmp$getFollowers(n=nMax)
  followersLocation = sapply(followers,function(x){location(x)})
  following = tmp$getFriends(n=nMax)
  followingLocation = sapply(following,function(x){location(x)})


  # Load the geographic data
  data(world.cities)
  data(us.cities)
  data(canada.cities)

  # Find the latitude and longitude of the user
  cat("Getting geographic (latitude/longitude) of Twitter users.\n")
  userLL <- findLatLon(userLocation)$latlon
  if(any(is.na(userLL))){stop("We can't find the latitude and longitude of your location from Twitter")}


  # Find the latitude and longitude of each of the followers/following
  # and calcualte the distance to the user

  followersLL = matrix(NA,nrow=length(followers),ncol=4)
  followingLL = matrix(NA,nrow=length(following),ncol=4)

  for(i in 1:length(followers)){
    if(length(followersLocation[[i]]) > 0){
      tmpLL = findLatLon(trim(followersLocation[[i]]))
      if(any(!is.na(tmpLL$latlon))){
        followersLL[i,] = c(unlist(tmpLL$latlon),distCosine(userLL,tmpLL$latlon),unlist(tmpLL$cont))
      }
    }
  }

   for(i in 1:length(following)){
    if(length(followingLocation[[i]]) > 0){
      tmpLL = findLatLon(trim(followingLocation[[i]]))
      if(any(!is.na(tmpLL$latlon))){
        followingLL[i,] =  c(unlist(tmpLL$latlon),distCosine(userLL,tmpLL$latlon),unlist(tmpLL$cont))
      }
    }
  }

  followingLL = followingLL[order(-followingLL[,3]),]
  followersLL = followersLL[order(-followersLL[,3]),]

  followingLL = followingLL[!is.na(followingLL[,1]),]
  followersLL = followersLL[!is.na(followersLL[,1]),]


  cat("Plotting results.\n")
  # Set up the colors
  cols = brewer.pal(7,"Set2")

  # Both followers and following
  if(plotType=="both"){
    #pdf(fileName,height=12,width=10)
    data(worldMapEnv)
    par(mfrow=c(2,1),mar=rep(0,4))
    map('world',col="#191919",bg="black",fill=T,mar=rep(0,4),border=0)

    mtext(paste("@",userName," Follower Map",sep=""),col="lightgrey")
    nFollowers = dim(followersLL)[1]
    for(i in 1:nFollowers){
      greatC = getGreatCircle(userLL,followersLL[i,1:2])
      lines(greatC,col=cols[followersLL[i,4]],lwd=0.8)
    }

    legend(-180,0,legend = c(paste("Asia",sum(followersLL[,4]==1)),paste("Africa",sum(followersLL[,4]==2)),paste("N. America",sum(followersLL[,4]==3)),paste("S. America",sum(followersLL[,4]==4)),paste("Australia/N.Z.",sum(followersLL[,4]==5)),paste("Europe",sum(followersLL[,4]==6))),text.col=cols[1:6],bg="black",cex=0.75)


    map('world',col="#191919",bg="black",fill=T,mar=rep(0,4),border=0)
    mtext(paste("@",userName," Following Map",sep=""),col="lightgrey")
    nFollowing = dim(followingLL)[1]
    for(i in 1:nFollowing){
      greatC = getGreatCircle(userLL,followingLL[i,1:2])
      lines(greatC,col=cols[followingLL[i,4]],lwd=0.8)
    }

    legend(-180,0,legend = c(paste("Asia",sum(followingLL[,4]==1)),paste("Africa",sum(followingLL[,4]==2)),paste("N. America",sum(followingLL[,4]==3)),paste("S. America",sum(followingLL[,4]==4)),paste("Australia/N.Z.",sum(followingLL[,4]==5)),paste("Europe",sum(followingLL[,4]==6))),text.col=cols[1:6],bg="black",cex=0.75)

    #mtext("Created by @simplystats twitterMap",side=1,adj=1,cex=0.8,col="grey")
    #dev.off()
  }

  ## Just followers
  if(plotType=="followers"){
    pdf(fileName,height=6,width=10)
    data(worldMapEnv)
    map('world',col="#191919",bg="black",fill=T,mar=rep(0,4),border=0)

    mtext(paste("@",userName," Follower Map",sep=""),col="lightgrey")
    nFollowers = dim(followersLL)[1]
    for(i in 1:nFollowers){
      greatC = getGreatCircle(userLL,followersLL[i,1:2])
      lines(greatC,col=cols[followersLL[i,4]],lwd=0.8)
    }

    legend(-180,0,legend = c(paste("Asia",sum(followersLL[,4]==1)),paste("Africa",sum(followersLL[,4]==2)),paste("N. America",sum(followersLL[,4]==3)),paste("S. America",sum(followersLL[,4]==4)),paste("Australia/N.Z.",sum(followersLL[,4]==5)),paste("Europe",sum(followersLL[,4]==6))),text.col=cols[1:6],bg="black",cex=0.75)
    #mtext("Created by @simplystats twitterMap",side=1,adj=1,cex=0.8,col="grey")
    #dev.off()

  }

  ## Just following
  if(plotType=="following"){
    #pdf(fileName,height=6,width=10)
    data(worldMapEnv)
    map('world',col="#191919",bg="black",fill=T,mar=rep(0,4),border=0)
    mtext(paste("@",userName," Following Map",sep=""),col="lightgrey")
    nFollowing = dim(followingLL)[1]
    for(i in 1:nFollowing){
      greatC = getGreatCircle(userLL,followingLL[i,1:2])
      lines(greatC,col=cols[followingLL[i,4]],lwd=0.8)
    }

    legend(-180,0,legend = c(paste("Asia",sum(followingLL[,4]==1)),paste("Africa",sum(followingLL[,4]==2)),paste("N. America",sum(followingLL[,4]==3)),paste("S. America",sum(followingLL[,4]==4)),paste("Australia/N.Z.",sum(followingLL[,4]==5)),paste("Europe",sum(followingLL[,4]==6))),text.col=cols[1:6],bg="black",cex=0.75)

    #mtext("Created by @simplystats twitterMap",side=1,adj=1,cex=0.8,col="grey")
    #dev.off()

  }

}


findLatLon <- function(loc){
  latlon = NA
  cont = NA

  # Asia = 1, Africa = 2, North America = 3, South America = 4, Australia/New Zealand = 5, Europe = 6
  continents = matrix(NA,nrow=length(unique(world.cities[,2])),ncol=2)
  continents[,1] = unique(world.cities[,2])
  continents[1:10,2] = c(1,1,1,2,1,1,1,1,1,1)
  continents[11:20,2]= c(1,1,2,1,1,2,1,2,2,2)
  continents[21:30,2] = c(2,1,6,6,6,6,6,6,6,6)
  continents[31:40,2] = c(6,6,6,6,2,4,4,1,2,1)
  continents[41:50,2] = c(4,6,1,4,6,1,3,1,6,6)
  continents[51:60,2] = c(3,2,4,2,6,1,6,1,3,2)
  continents[61:70,2] = c(1,2,2,2,3,6,3,3,6,6)
  continents[71:80,2] = c(1,1,2,6,3,4,3,4,6,1)
  continents[81:90,2] = c(3,3,3,2,2,6,6,6,6,4)
  continents[91:100,2] = c(2,5,2,2,3,1,1,1,1,1)
  continents[101:110,2] = c(1,2,1,1,1,3,2,5,1,6)
  continents[111:120,2] = c(1,6,1,1,2,6,1,1,6,2)
  continents[121:130,2] = c(6,6,6,1,1,3,4,3,4,2)
  continents[131:140,2] = c(6,6,2,2,1,1,1,4,1,1)
  continents[141:150,2] = c(1,2,2,1,1,1,4,6,6,2)
  continents[151:160,2] = c(4,1,1,1,1,2,4,6,2,2)
  continents[161:170,2] = c(1,2,2,1,6,2,1,1,6,1)
  continents[171:180,2] = c(1,1,1,2,6,2,2,6,1,1)
  continents[181:190,2] = c(2,6,2,1,6,6,3,3,3,3)
  continents[191:200,2] = c(2,2,2,2,3,2,3,2,3,1)
  continents[201:210,2] = c(3,2,2,2,2,2,2,1,6,2)
  continents[211:220,2] = c(1,3,1,6,2,4,3,6,3,4)
  continents[221:230,2] = c(1,1,1,3,2,3,3,6,1,6)
  continents[231:232,2] = c(2,1)


  # Get the first element of the location
  firstElement = strsplit(loc,"[^[:alnum:]]")[[1]][1]
  #firstElement = strsplit(loc,",")[[1]][1]
  if(is.na(firstElement)){firstElement="zzzzzzzzz"}

  # See if it is a city
  tmp = grep(firstElement,world.cities[,1],fixed=TRUE)
  tmp2 = grep(firstElement,state.name,fixed=TRUE)
  tmp3 = grep(firstElement,world.cities[,2],fixed=TRUE)

  if(length(tmp) == 1){
    latlon = world.cities[tmp,c(5,4)]
    cont = continents[which(world.cities[tmp,2]==continents[,1]),2]
  }else if(length(tmp) > 1){
    tmpCities = world.cities[tmp,]
    latlon = tmpCities[which.max(tmpCities$pop),c(5,4)]
    cont = continents[which(tmpCities[which.max(tmpCities$pop),2]==continents[,1]),2]
  }else if(length(tmp2) == 1){
    latlon = c(state.center$x[tmp2],state.center$y[tmp2])
    cont = 3
  }else if(length(tmp3) > 0){
    tmpCities = world.cities[tmp3,]
    latlon = tmpCities[which.max(tmpCities$pop),c(5,4)]
    cont = continents[which(tmpCities[which.max(tmpCities$pop),2]==continents[,1]),2]
  }

  return(list(latlon=latlon,cont=as.numeric(cont)))

}


getGreatCircle = function(userLL,relationLL){
  tmpCircle = greatCircle(userLL,relationLL)
  start = which.min(abs(tmpCircle[,1] - userLL[1,1]))
  end = which.min(abs(tmpCircle[,1] - relationLL[1]))
  greatC = tmpCircle[start:end,]
  return(greatC)
}

trim <- function (x) gsub("^\\s+|\\s+$", "", x)